JAKARTA IS SINKINGSENTINEL-1 INSAR 2017–2023 · 267 KELURAHAN · SNAPSHOT 2026-08-30
Land subsidence + flood exposure
The ground under Jakarta is moving.
Radar interferometry from orbit measures the city sinking — and measures it
slower than the famous numbers, in different places. Over 2017–2023 the fastest
ground loses a few centimetres a year, and much of it is inland in the west, not on the
coast. This case turns that measurement into what a city, an insurer or a utility needs:
which kelurahan, how fast, and how much of it is still moving.
441,934 people in DKI Jakarta live on ground
sinking faster than 2 cm a year. In 16 of
261 measured kelurahan the fastest tenth of the ground drops more than that.
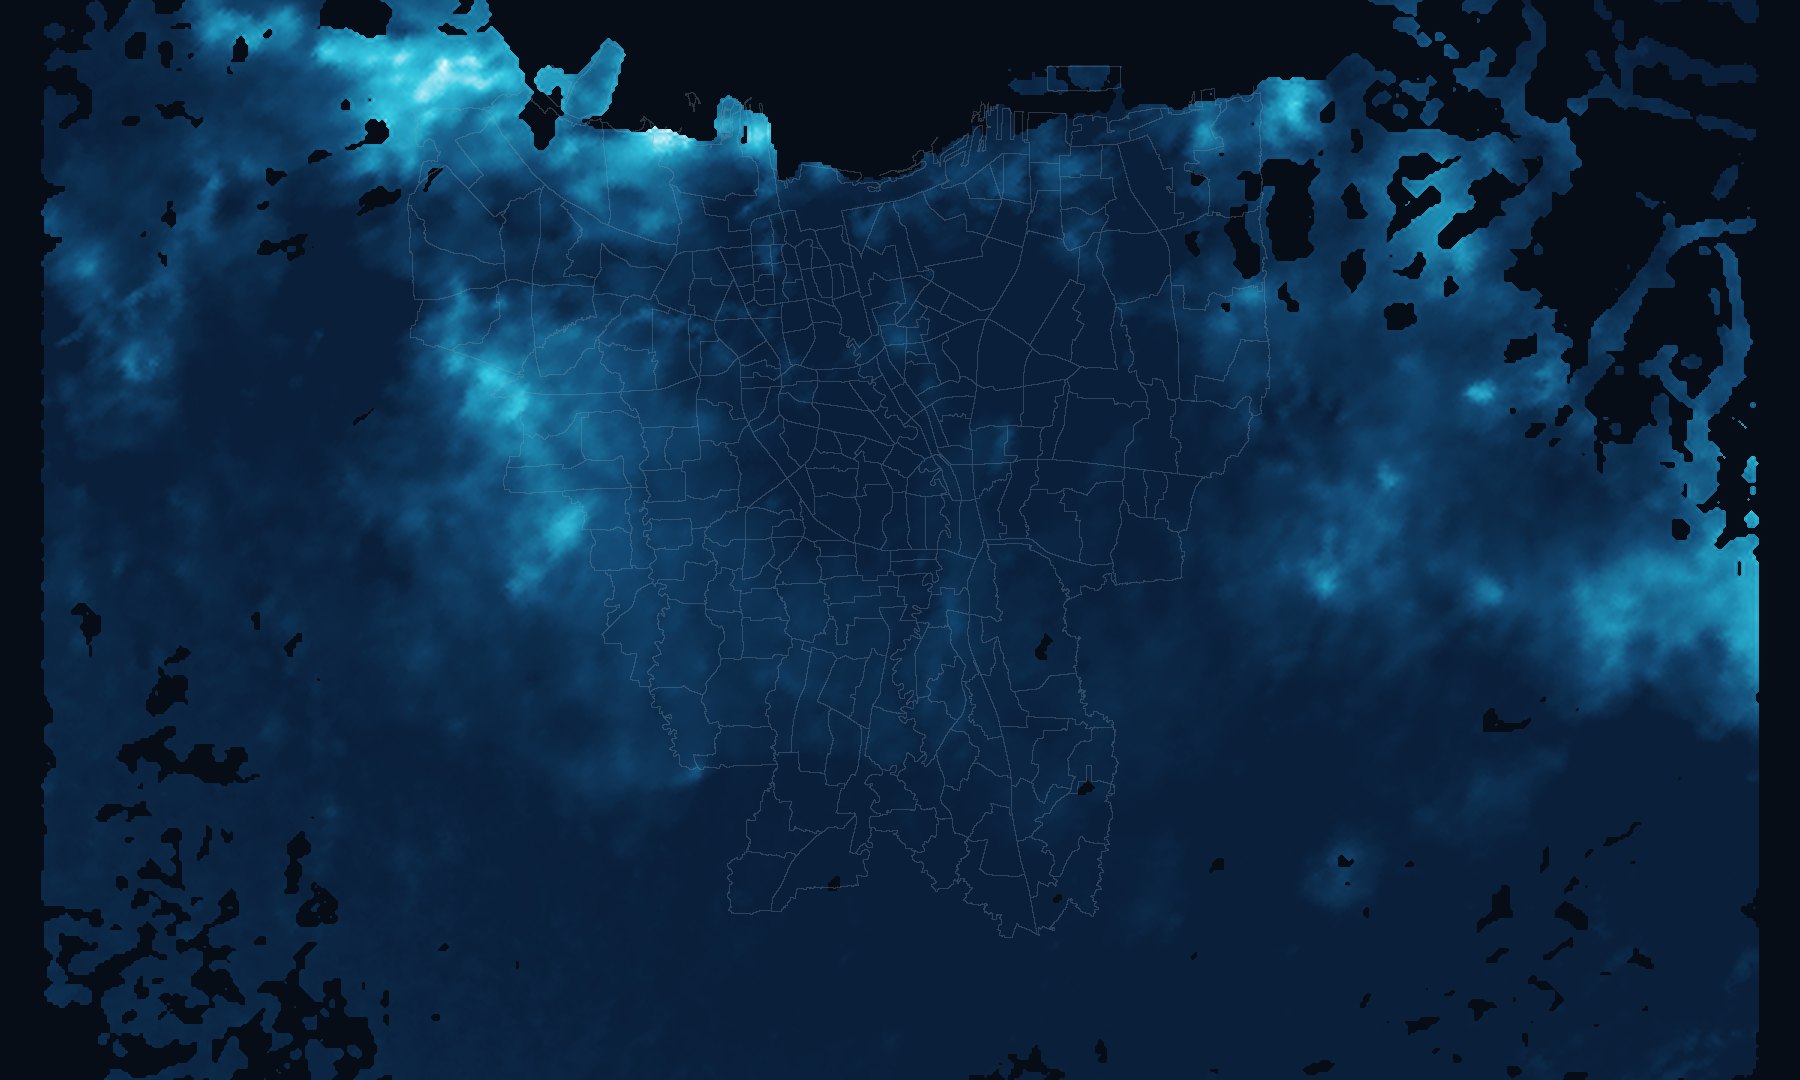
The map colours every kelurahan by its rate over 2017–2023: the fastest decile (p10)
shows the hotspot cores the way the literature's peak values do; the median tells the
neighbourhood story. Fastest single decile: Pluit (Jakarta Utara),
−3.99 cm/yr, −1.77 at the median.
Toggle the velocity field to see the measurement itself — including Tangerang and Bekasi,
which the kelurahan table does not cover.
It is not only a coastal story any more. Of the 20 fastest-subsiding kelurahan by
median rate, 12 are in West Jakarta and only
4 in North Jakarta; just
6 of the 20 sit in the coastal belt. Across the city, sinking
rate and low ground are close to independent (rank correlation ρ = 0.149):
the fastest ground includes inland West Jakarta kelurahan whose low ground sits several metres
up, which is a foundation and buried-pipe problem rather than a flooding one.
Why it sinks: decades of groundwater extraction compacting the young
alluvial and marine clays under the coastal plain, with the load of the built city on top —
the mechanism is well documented (Abidin et al. 2011; Chaussard et al. 2013; Ohenhen et al. 2026).
And it has slowed: on the continuous GNSS record the central-Jakarta station CJKT drops from −8.6 mm/yr over 2010–2016 to −3.8 mm/yr over 2017–2022, and all 3 stations inside this working area slowed, while 12 of 17 elsewhere on the north Java coast got faster.
The 10–25 cm/yr figures still quoted for Jakarta are from the 1990s and 2000s.
NAMED HOTSPOTS · CM/YR · 2017–2023 · MEDIAN | FASTEST DECILE · PUBLISHED RANGE
Kosambi−4.36 | −5.182–6 · gate
Muara Baru−4.15 | −4.922–6 · gate
Kamal Muara−2.35 | −3.112–6 · gate
PIK / Kapuk Muara−2.44 | −3.002–6 · gate
Pluit−1.17 | −2.48
Penjaringan−1.05 | −1.99
Cengkareng−0.54 | −0.91
Ancol−0.21 | −0.79±1 · gate
Monas (central)+0.16 | −0.21±1 · gate
These rates are lower than the peaks in circulation for Jakarta, for two
separate reasons. Part is scale: this field averages ~75 m cells, so a core reads lower than a
persistent-scatterer point. Part is time — the ground genuinely slowed between the 2000s surveys
and this window, which the GNSS record confirms. Contemporaneous Sentinel-1 studies of the same
city over the same years still disagree with each other by a factor of about four, so read these
numbers to one significant figure, not two. The review article works through both.
02 · The clock
Where the ground goes next — if nothing changes
On this model 0.39 M people stand on
ground below +1 m today, 0.42 M by 2030 and
0.47 M by 2050 if the 2017–2023 rates hold; below mean sea
level, 0.12 M → 0.19 M.
Read those as an ordering, not as counts. "Ground" here is the lowest of the
roughly nine 30 m elevation pixels in each 100 m cell — a way of finding roads and yards rather
than roofs in a surface model, but also a minimum of nine noisy samples. Computed on the cell
mean instead, the same grid and the same population give 35,965 below +1 m rather
than 391,029 — a factor of 10.87. The published figure is,
on the cell mean, the population below +2.93 m. The
ranking of kelurahan survives this; the absolute counts do not.
This is a linear extrapolation, not a forecast, and its assumptions are worth more than
its signal. Each 100 m cell's ground drops at its measured 2017–2023 rate, year after year; cells
without radar coverage are held still. Groundwater policy, the sea wall, drainage, rainfall and
sea-level rise are all outside the model. Ground height comes from Copernicus GLO-30 — a 30 m
surface model acquired 2011–2015, with ±2–4 m vertical accuracy.
At its median rate, Kedaung Kali Angke (Jakarta Barat) — low ground at 0.1 m — reaches mean sea level in about 15 years; 14 kelurahan already have low ground below it, and exactly 1 more crosses it inside the window this clock animates.
Three assumptions, priced. Correcting the twelve-year-old elevation
model for subsidence since acquisition moves today's count from 391,029
to 432,584 — a number this clock does not otherwise reach until
2037. Raising the sea-level datum 15 cm, within the range implied by
measured Java Sea rise, takes 2050 to 536,337. Letting the rate decay at
the halving time the Jakarta GNSS station actually shows, instead of holding it flat, takes 2050
down to 422,303. Two of those make the clock optimistic and one makes it
pessimistic: the honest 2050 bracket is 422,303–508,612
on assumptions alone. The review article works through all three.
And one number here is a rounding artefact. The elevation model pins
water and near-shore cells to exactly 0.00 m, where 61,713 people
live. They sit one arbitrary millimetre above the mean-sea-level threshold, so the below-MSL
count jumps 43,886 between 2025 and 2026 — 62%
of the entire 25-year rise — and then adds a median of 1,103 a year.
Use the below-MSL series for its shape after 2026, not for its 2025 level.
2025
PEOPLE BELOW—
BUILT-UP BELOW—
KELURAHAN MOSTLY BELOW—
0%50%100%residents below threshold
City totals by year for both thresholds; hover the chart to move the clock.
Only kelurahan on the mainland are counted; Kepulauan Seribu lies outside the velocity field.
03 · Who is exposed
Who stands on the lowest ground
Ranked by residents (WorldPop 2020) or built-up surface (GHSL 2020) on ground below the
threshold in the clock's year. Click a bar to open the kelurahan; the maps follow.
What this ranking is made of. It is overwhelmingly an elevation
ranking. Recomputed with the radar switched off — every velocity set to zero — the 2050 order is
rank-correlated ρ = 0.959 with the published one and shares
19 of its top 20. Against the measured sinking rate the
published ranking correlates only ρ = 0.219.
Twenty-five years of subsidence move the city total from 391,029 to
468,034. Treat this as a low-ground map with a subsidence
adjustment; for the subsidence signal itself, read chapter 01.
04 · Does it hold up?
Checks before the story
Three things sit beside the radar field: continuous GNSS stations (Susilo et al. 2023,
millimetre-level vertical rates), the published literature on Jakarta's hotspots, and the
depositors' own published statistics for the same data. Then the exposure numbers are checked
against the census and against floods that actually happened. Two of these checks were
misdescribed on this page before the review; the corrections are below the tables.
GNSS station
GNSS vertical mm/yr
InSAR mm/yr
Δ
Cells
±5 mm/yr
CJKT
-6.4
-4.6
1.8
42
PASS
CTGR
-2.9
-1.4
1.5
42
PASS
CBTU
-0.5
1.9
2.4
40
PASS
#
Check
Result
Detail
1
Literature agreement
PASS
NW-coast hotspots: fastest decile ≥ 2 cm/yr and neighbourhood median ≥ 1 cm/yr; central Jakarta within ±1 cm/yr
2
GNSS agreement
PASS
InSAR vertical rate within ±5 mm/yr of Susilo et al. 2023 at CJKT, CTGR, CBTU
3
Own LiCSBAS run vs the deposit
DEFERRED
Deferred — 13 GB LiCSAR download; pixelwise r ≥ 0.7, hotspot medians within 1 cm/yr
4
Exposure sanity
PASS
267 kelurahan · WorldPop 10,724,798 (+1.5% vs census 10.6 M) · GHSL -2.1% vs WorldPop · 100% of mainland kelurahan with ≥30% InSAR coverage
5
Flood plausibility
FAIL
Spearman ρ exposure index vs BPBD flood events = 0.164 (threshold 0.5; low-ground share -0.135, sinking rate 0.323) · 2020 flood covered 12% of the 20 most exposed kelurahan vs 5% of all
The plausibility check fails, and the failure is the finding — not an apology.
Where Jakarta floods and where Jakarta sinks are different places, and an agency that plans
drainage from a subsidence map will defend the wrong neighbourhoods. BPBD's 2021–2024 record is
dominated by riverine floods along the Ciliwung and its tributaries in East Jakarta —
Kampung Melayu (72 event dates), Cawang (67 event dates), Cililitan (54 event dates) — kelurahan on
higher ground that barely subside. Across the city, flood frequency is inversely related to
low ground (ρ = -0.135) and only weakly to the sinking rate
(ρ = 0.323). Subsidence-driven exposure is a coastal, tidal and drainage
problem, and it is the January 2020 extent — one extreme event seen by Sentinel-1 — that overlaps
the most-exposed kelurahan disproportionately: 12% of their area
against 5% city-wide. We keep the gate red rather than redefine it to pass.
Correction: the GNSS gap is a period gap, not a frame offset. This page previously
explained the ≈2 mm/yr difference in the table above as an InSAR reference-frame effect. That was
wrong. The depositors transform their field into the same global frame family the GNSS solutions
use, and the published GNSS rates are fitted over each station's whole record — at CJKT,
2010–2022 — while the radar covers 2017–2023. Refitting each station on the radar's own window
(with annual and semi-annual terms removed) collapses the disagreement from
+1.78 ± 0.51 mm/yr
to −0.03 ± 0.89.
The field is tied far better than the table suggests, and the residual it was hiding is the real
signal in chapter 01 — the ground slowed down between the two windows.
The strongest check is a replication. The depositors publish per-municipality statistics
for this same field (Ohenhen et al. 2026, table S2). Regridding their point cloud independently —
different resampling, different boundary file, different zonal method — reproduces that table
across all five Jakarta municipalities, with a largest disagreement in the mean of
0.032 cm/yr. The ingest, filter, gridding and zonal
steps are faithful.
The GNSS comparison is a consistency check rather than an independent one: the
depositors used stations from this same archive to align their field to the global frame, so it
cannot fail unless something is badly broken. Genuinely independent reprocessing — our own LiCSBAS
run over LiCSAR frame 098A (2017–2024) against this deposited field — is pending; it needs a 13 GB
download and runs after the flagships' bandwidth frees.
05 · Review
We had this case reviewed, adversarially.
An independent read of the same data against the published literature, and against the GNSS
archive that was already on this case's disk. It reproduces the depositors' own per-municipality
table to 0.032 cm/yr,
shows that the GNSS gap this page used to blame on a reference frame is really a period gap —
Jakarta's subsidence has roughly halved while its neighbours' has accelerated — prices the three
assumptions inside the clock, and demonstrates that the exposure ranking is
ρ = 0.959 identical to the same ranking with
the radar switched off. Every correction it asked for has been applied above.